July 2021 LIP of the Month
Are regional topographic changes and sedimentary basins (+associated ore deposits?) linked to mantle plumes?
Event-based stratigraphic maps on continental scales and their role in understanding first-order controls on the occurrence of distinct geological intraplate events
Anke M. Friedrich and Hans-Peter Bunge
Ludwig-Maximilians-Universität München (Germany), friedrich@lmu.de
From a geological perspective there is ongoing debate over origin and cause of several distinct geological features such as LIPs, radiating dike swarms, sedimentary-hosted ore deposits, records of glaciation or of mass extinctions. It is also not clearly known whether events such as narrow- versus wide rifting or radiating versus circumferential dike systems always yield the same space-time-relationship relative each other. A related debate focusses on reasons for why some passive margins are elevated and affiliated with seaward-dipping reflectors while other portions along the same margin are neither uplifted, nor yield reflectors. Some argue that these features occur at random in time and space throughout Earth history, while others argue that such events are triggered by plumes rising from within the Earth’s mantle and their associated tectonic, magmatic, and environmental effects. Additional skepticism exists towards interpretations that invoke a dynamically convecting mantle in the absence of measurable gravity anomalies to explain long-wavelength uplift of the Earth’s surface, such as observed in numerous recent and ancient uplifted plateaus and elevated domes. Unless theoretical models of mantle convection are tested against geological observations, it will be impossible to know which patterns and relationships are correct. However, a limited understanding of the first-order factors, which control the spacio-temporal distribution of major ore-forming events, leads to missed opportunities in the discovery of new commodities and might result in higher exploration and production costs.
From a geodynamic perspective, the dominant debate doesn’t center on whether whole-mantle convection exists, or whether the mantle is iso-viscous, but — for example — on what its viscosity structure is and whether there are any independent geological data at interregional scales against which geodynamic models can be tested. Such tests would help to identify unrealistic modeling scenarios and focus on those that are consistent with geological observations. However, such geological data compilations are rarely available at scales of geodynamic relevance, and they traditionally consist of qualitative visualizations of paleoenvironments. In turn there is some doubt within the geological community about whether intraplate processes operate at interregional scales.
Currently, a major problem is that the scales at which geodynamic models of mantle convection operate (a few thousands of kilometers, intercontinental, see Figure 1 – Movie; https://youtu.be/ODOOfZ91qXw)) are not the same as those on which geological data are typically compiled (tens to hundreds of kilometers at best, local to regional). Thus, there is a need for geological data integration at intercontinental scales. A major challenge also lies in knowing which geological features belong to a larger first-order process instead of them being unrelated and accidentally superposed in time and space. While empirical studies provide multiple working hypotheses, theoretical considerations must be invoked to discriminate among them.
Paleogeological Hiatus Maps
To overcome these limitations, common language and best-working practice need to be developed. So, is there any geological information a priori that yields a quantifiable record of vertical surface motion at interregional scales? Yes, of course. In a single step, a lot of information can be extracted from published geological maps, which we displayed as a new type of paleogeological maps that show the gaps in time (hiatus, in Ma) at the base of each geological series (the typical unit of continent-scale maps) across the map (Friedrich et al. 2018, Friedrich 2019). Each basal series-datum can be displayed in this way, yielding the pattern of hiatus area across the entire map. It is quickly apparent that the hiatus patterns change from series-datum to series-datum and that each time slice contains a certain ratio of hiatus area / area of conformity. Thus, published geological maps show that hiatus area at any given time is limited in time and space, which is consistent with the notion that there is no global tectonic process that results in global-scale uplift /subsidence, nor is there global-scale transgression/regression at the series resolution (Friedrich et al. 2018, Friedrich 2019; Carena et al. 2019; Hayek et al. 2020). Of course, an immediate major limitation is the limited temporal resolution (geological series, tens of Myr) of published continent-scale maps, which implies that only the biggest events area visible in such maps. To better visualize the true quantity of hiatus for any given series-datum, the next generation of geological maps will need to be resolved at geological stages (1-2 Myr) instead. An increase in temporal resolution of the paleogeological maps will yield a different answer, with some conformable contact segments turning to hiatus. Thus, geological maps at systems or series resolution are heavily biased towards showing the depositional record, whereas geological maps at stages resolution would be more biased towards hiatus, i.e., missing record. It would increase the surface area that has undergone uplift and/or erosion at the given time of interest.
Summary
A coherent spatial reference frame is readily available at intercontinental scales in form of standard geological maps, however, future efforts must focus on compiling geological data coherently and at the higher time-resolution of stages to match the anticipated vertical rates of surface motion and their changes over time. Such information exists in the form of chronostratigraphic charts for individual regions and countries of the Earth. A major community effort is needed to construct the next generation of geological maps at intercontinental scales and at stages resolution. You can help or participate! If you know of any chronostratigraphic charts for your favorite region, please send them to us (friedrich@lmu.de) or let us know and we’ll help you analyze them yourself in ways described above.
For further interest in this problem, please consult Friedrich et al. (2018). In this paper, we describe the basic procedure of constructing global hiatus maps (cf. Friedrich 2019) since the break-up of Pangea to demonstrate that an observational basis exists against which geodynamic models can be compared. Since then, we have tested the hiatus mapping method on data from Europe and the North Atlantic realm (Vibe et al. 2019) and created an updated global hiatus model (Hayek et al., 2020, and corrections published in 2021, see Figure 2). As also described above, the information basis shown in the hiatus maps needs to be improved in by adding geological data at high time-resolution. There are several ways of doing this as so far described by Friedrich (2019), Carena et al. (2019), and Hayek et al. (2020, see also correction by Hayek et al. 2021).
Furthermore, in Friedrich et al. (2018), we also summarize the established geodynamic theory of mantle convection (see Figure 1—Movie; https://youtu.be/ODOOfZ91qXw), provide references to the original work, and describe how to turn the theoretical considerations of a rising plume into a geological and stratigraphic framework (Figure 3). We show the results as a series of chronostratigraphic charts and paleogeological maps, which can be used to identify the tempo-spatial dimensions of the rich geological record expected to form as a plume rises, ponds at the base of the lithosphere and disperses laterally.
We also applied this event-based plume-stratigraphic mapping method to published geological continent-scale maps allowing identification of a plume head’s central area (defined as yielding strong uplift, erosion, dike swarms, narrow rifts, internal drainage with sediments followed by flood basalts), its distal area (characterized by an hypothetically continuous sedimentary record), and an area of great geological interest between the central and the distal region that is characterized by multiple episodes of uplift and subsidence (inversion) and the corresponding nonconformity and disconformities in the stratigraphic record. Distinguishing between the different domains is based on clearly defined “mapping contacts” such as a field geologists would define them. Therefore, if the same definitions are applied, this method yields repeatable results. Mapping of the contacts bounding the “plume margin” (Friedrich, in preparation) on different time slices will yield shifting boundaries, which is to be expected if a plume rises vertically and later disperses laterally (see Friedrich et al. 2018). A recent doctoral student at the University of Heidelberg, Florian Krob, tested this mapping method for the geological data related to the Parana-Etendeka LIP. Please refer to Krob et al. (2020) for this interesting work.
Figure 1: Movie https://youtu.be/ODOOfZ91qXw Standard Mantle Circulation Model (MCM, see Bunge et al., 1998), computed for the last 200 million years at high numerical resolution (~85 million grid points) and the assumption of an isochemical (pyrolite) mantle composition. The two isosurfaces (blue=cold, red=hot) show regions where temperature is 600/450 K lower/higher than the layer average. MCM structure is dominated by localized hot upwellings (red isosurfaces) that originate at the core mantle boundary and spread out laterally beneath the Earth’s surface, specifically in the central Pacific and African domain. Cold downwellings (blue isosurfaces) dominate in the western Pacific due to the numerous subduction zones located in that region.
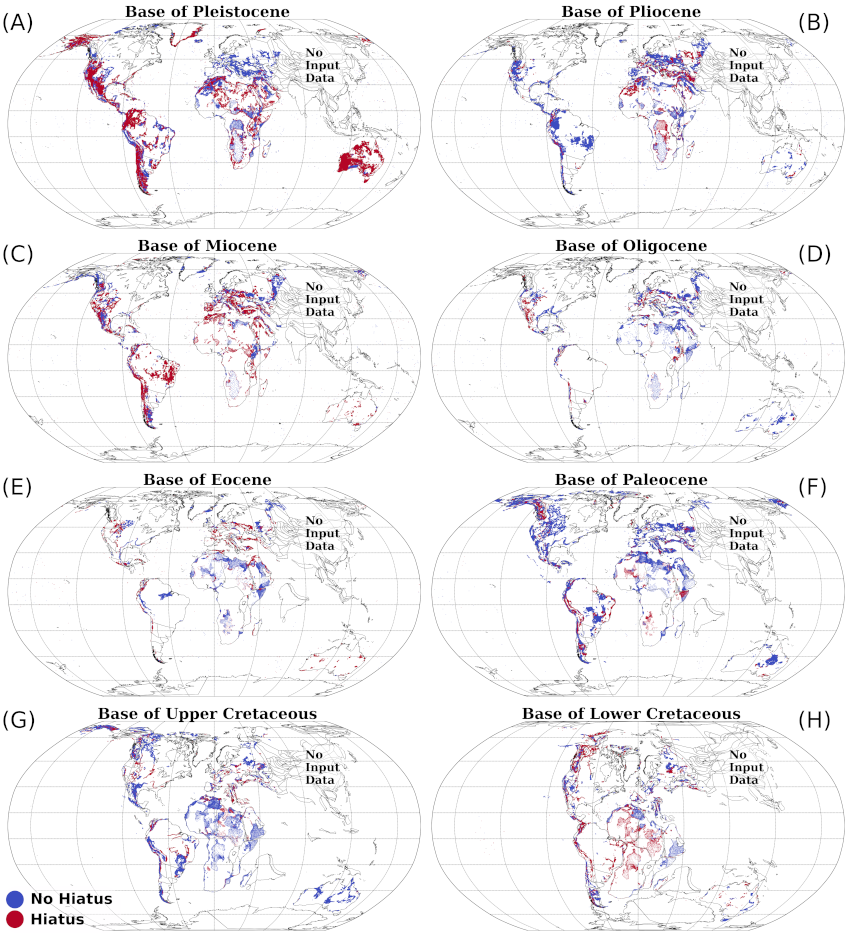
Figure 2: Geological Hiatus Maps (GHMs) at chronostratigraphic division of series from the Base of Pleistocene datum to the Base of Lower Cretaceous datum (a–h) reconstructed paleogeographically with a global Mesozoic-Cenozoic plate motion model tied to a reference frame of Indo-Atlantic hotspots and shown in a plate tectonic configuration corresponding to the base of each series. Red/blue points represent un/conformable contacts, respectively. Blank regions indicate the absence of considered series and its immediately preceding unit. From Revised Figure 4 in Hayek et al. (2021).
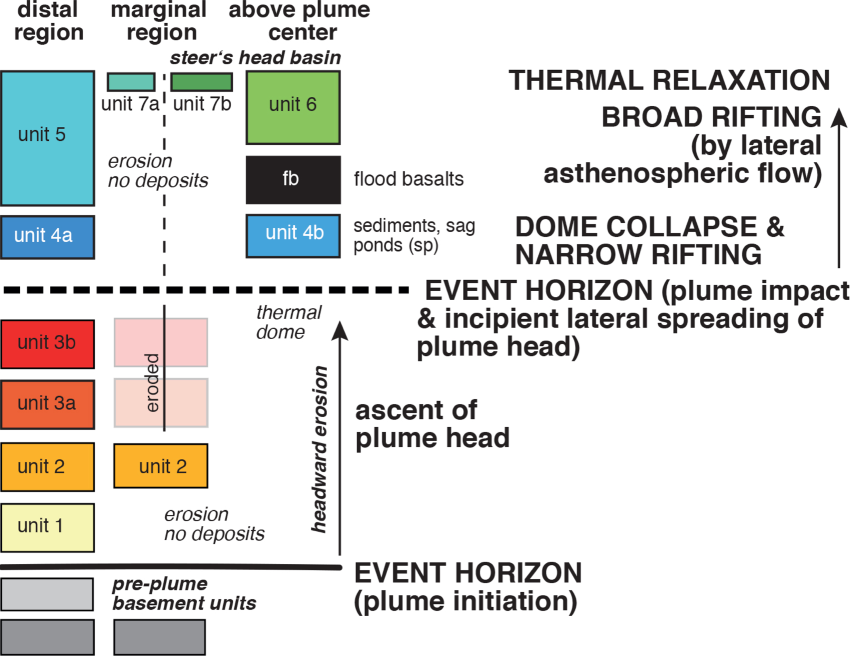
Figure 3: Legend with definition of mapping units to generate an event-based plume-stratigraphic map. Please refer to Figure 7 and see also Figures 6 to 8 in Friedrich et al. (2018).
References:
Hayek, J.N., Vilacis, B., Bunge, H.-P., Friedrich, A. M., Carena, S., Vibe, J., 2020, Continent-scale Hiatus Maps for the Atlantic Realm and Australia since the Upper Jurassic and links to mantle flow induced dynamic topography, Proceedings of the Royal Society A, https://doi.org/10.1098/rspa.2020.0390 (see correction of Figure 2, published as Hayek et al. 2021: https://royalsocietypublishing.org/doi/full/10.1098/rspa.2021.0437 )
Krob, F.C., Glasmacher, U.A., Bunge, H.-P., Friedrich, A.M., Hackspacher, P.C., 2020, Application of stratigraphic frameworks and thermochronological data on the Mesozoic SW-Gondwana intraplate environment to retrieve the Parana-Etendeka plume environment; Gondwana Reserach, 84, 81 –110. https://doi.org/10.1016/j.gr.2020.02.010
Carena, S., Bunge H.P., and Friedrich, A.M., 2019, Analysis of geological hiatus surfaces across Africa in the Cenozoic and implications for the timescales of convectively-maintained topography. Canadian Journal of Earth Sciences. https://doi.org/10.1139/cjes-2018-0329
Friedrich, A. M., 2019, Palaeogeological hiatus surface mapping: a tool to visualize vertical motion of the continents, in Meinhhold, G., (ed) advances in Palaeogeography, Geological Magazine, v.156, #2, 308 - 319, Cambridge University Press. https://doi.org/10.1017/S0016756818000560.
Friedrich, A. M., Bunge, H. P., Rieger, S. M., Colli, L., Ghelichkhan, S., & Nerlich, R. (2018). Stratigraphic framework for the plume mode of mantle convection and the analysis of interregional unconformities on geological maps. Gondwana Research. https://doi.org/10.1016/j.gr.2017.06.003.
Vibe, Y., Friedrich, A.M., Bunge, H.-P.; Clark, S.R., 2018, Correlations of oceanic spreading rates and hiatus surface area in the North Atlantic realm, Lithosphere, v. 10, # 5, 677 - 684, https://doi.org/10.1130/L736.1.